Home Energy Monitoring: Rowan University Energy Monitoring System (RUEMS)
Kevin A. Bellomo-Whitten, Eric Guidarelli, and Jeffery Welder

With the current push for a unified Internet of Things (IoT) in the power industry, it is becoming increasingly important to have a simple way to monitor and regulate power consumption on a consumer level. The necessity for buildings to become Smart Buildings is on the rise, and new emerging hardware and software must come in to play for this to occur. However, as with all things, cost to the consumer becomes a key factor which can limit the typical home user from being able to accurately monitor their home power use.
Renewable Energy
Adding a renewable energy source can supplement a buildings electrical loads while reducing that buildings carbon footprint
User Independence
End user can draw power from their renewable technologies, save energy for emergency situations, or export energy to the grid for cost savings
Utility benefits
More local resources that can offer additional power will help stabilize the grid during peak hours without requiring additional equipment
The post herein describes research performed by students at Rowan University to create a low cost, intelligent monitoring system which can appeal to the typical home user.
Monitor Grid
Has the ability to gather relevant data from the grid like time-based energy rates, or real time weather data like cloud coverage, and sunrise/sunset times
Set Preferences
Rules can be created that determine the power source for the system, when to sell energy back to the grid based on gathered data, and what to do in emergency situations
Smart Responses
During peak hours of the grid, the system could switch to an alternate cheaper power source, or decide when to sell back excess power, and in emergency situations switch to a backup source to avoid blackouts
Due to the constraints set on a one-semester projects timeframe, only the monitoring portion of the system described above was made.
Three key components were required to create a monitoring system for this project. A simulation tool was required to model a micro-grid (uGrid) over a 24 hour period. This would have to handle simulating inputs like utility power, renewable energy source, an energy storage unit, and of course the monitoring system. Second, a way of generating mock data for the simulation to run on. Finally, a system of communication is required to feed the mock data into the simulation, and pull the results out.
Simulation Type
MathWorks has a toolbox for the SimuLink program that has power grid components. The teams previous experience and the existence of this toolbox made SimuLink the best choice.
Monitoring System
A Raspberry Pi was available at the start of the project and was chosen as the monitoring system that would gather the mock relevant data.
Communication
The simulation and monitoring system should communicate over wireless User Datagram Protocol (UDP).
The simulated uGrid was expressed as a power network of single-phase AC (200 V). Solar power generation (maximum 5kW) was attached as a renewable energy source. Power sources were system power, solar power generation, and a storage battery (150 V, 30 Ah). The storage battery is controlled by a battery controller, and it absorbs surplus power if there is surplus power in the uGrid or it supplies insufficient power if there is a power shortage in the uGrid. Three generic household devices consume power (maximum 2.5kW) as electric loads.
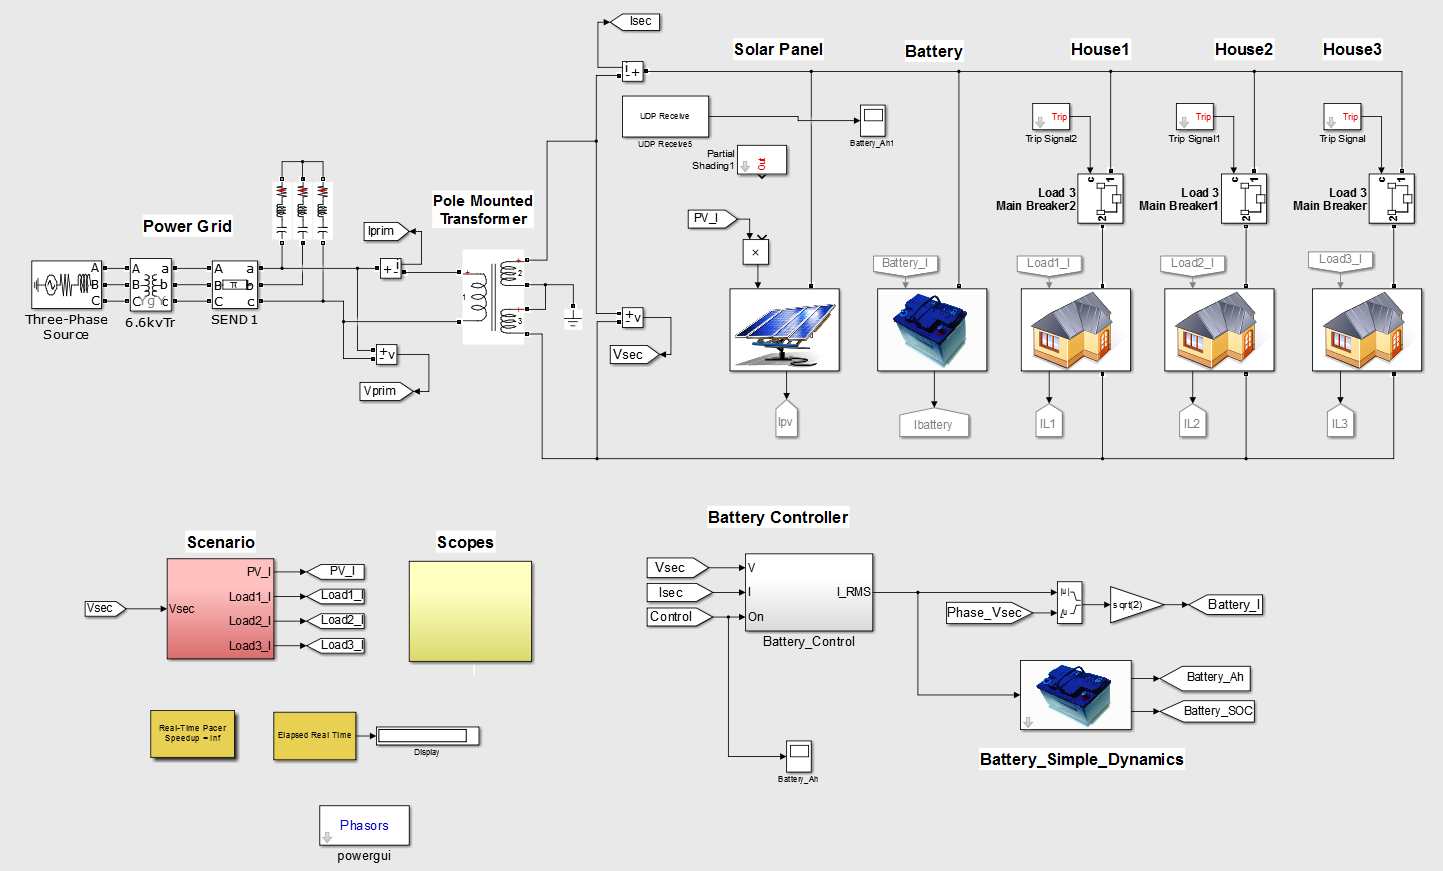
To more accurately represent a full, self-sustaining grid, the uGrid is connected to the system power via a pole-mounted transformer. The voltage source (66 kV) of three phase alternating current of the system power is connected to a transformer (primary 66 kV /secondary 6.6 kV) which decreases voltage from 66KV to 6.6 KV. The pole-mounted transformer (primary 6.6kV /secondary 200 V) changes the voltage from 6.6 kV to single-phase AC (200 V). The frequency of AC cycles is set to 60 Hz. The solar power generation and the storage battery are simulated as DC power sources converted into single-phase AC. These are both connected to the uGrid. It is assumed that in control strategy, the uGrid does not depend on system power for power consumption, and required power is provided by solar power generation and the storage to the extent possible.
To implement the real-time sensor data readings, the simulation took advantage of the Raspberry Pi’s built in I2C capabilities. To correctly interface the I2C components with Simulink, a block was used from the Matlab Exchange network to create the architectural links between the physical ADS1115 readings and the simulation.
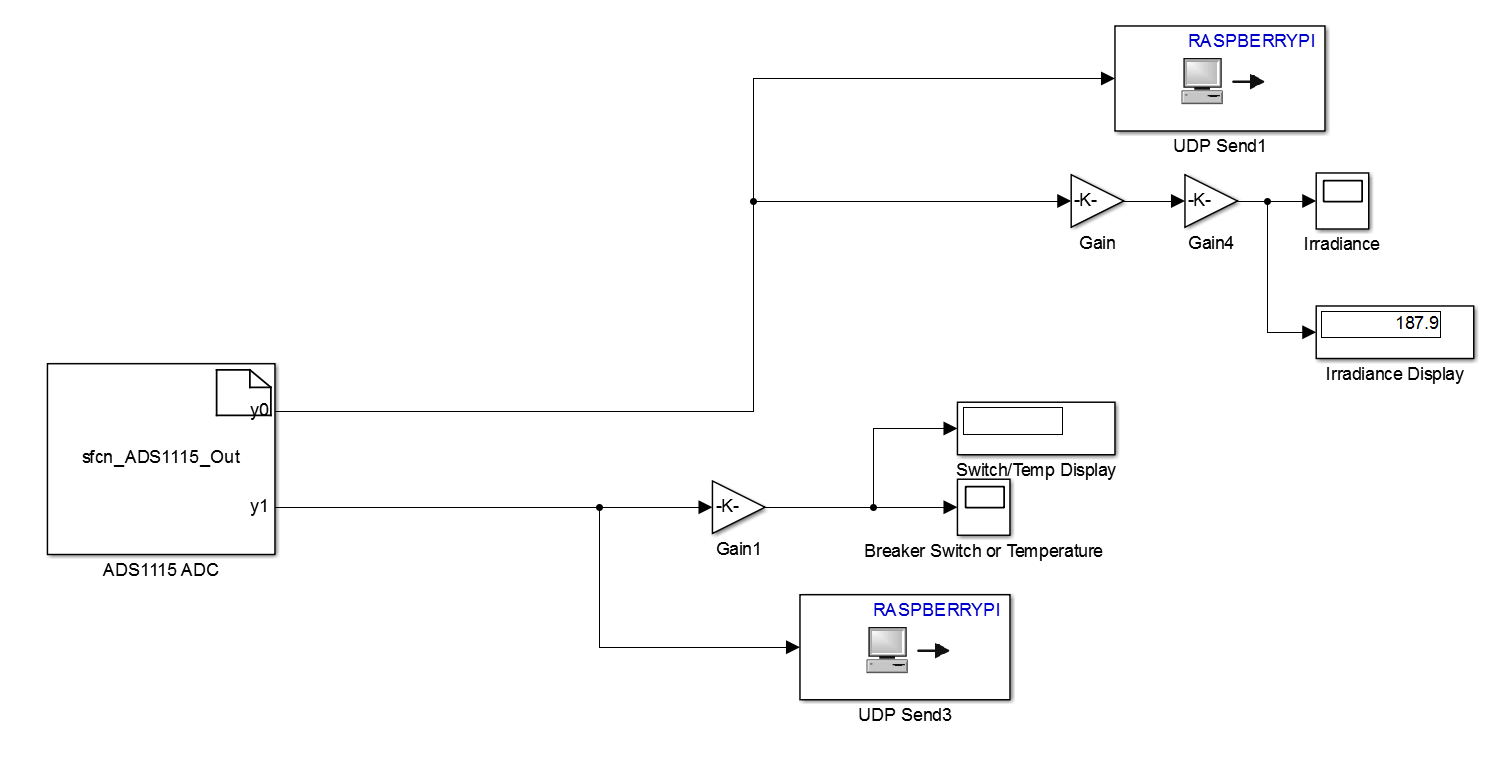
To implement the real-time sensor data readings, the simulation took advantage of the Raspberry Pi’s built in I2C capabilities. To correctly interface the I2C components with Simulink, a block was used from the Matlab Exchange network to create the architectural links between the physical ADS1115 readings and the simulation.
With the simulation in place, the wireless communication between the system and the Raspberry Pi was then implemented via a UDP protocol.
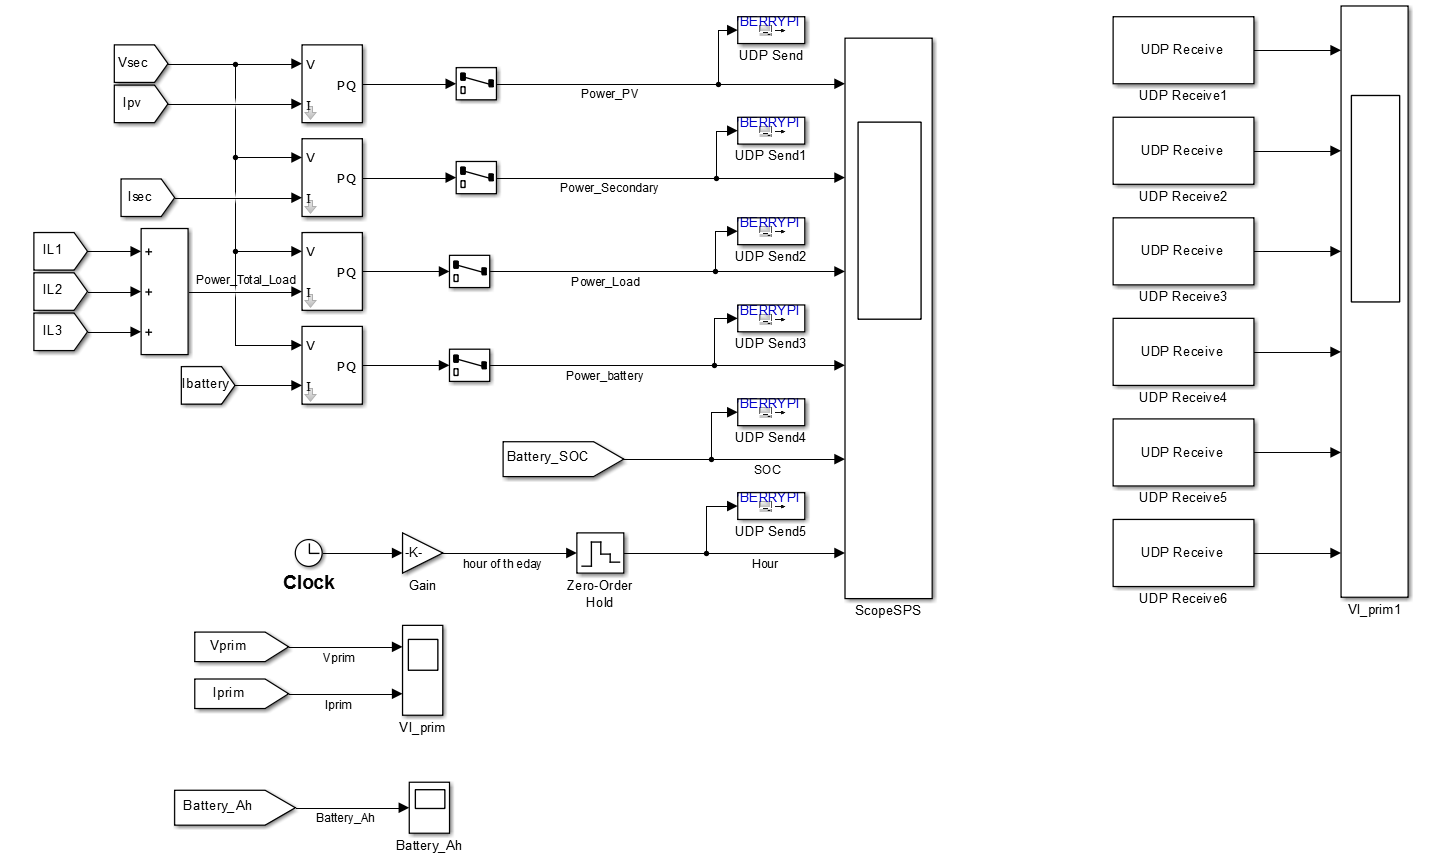
The appropriate output data was first sent to a scope ‘ScopeSPS’ to visually verify that all parts of the simulation were being output correctly. Then, using specialized UDP Send blocks obtained from the Simulink Support Package for Raspberry Pi , each dataset was broadcast to a specific port ID on the local wireless network. With the Raspberry Pi connected to the wireless network, and the virtual Raspberry Pi interface connected via Simulink, UDP packets were then able to be sent from the simulation wirelessly to the Raspberry Pi, and then broadcast on the network from the device hardware. It was then a simple procedure to call on the specified ports using UDP Receive blocks native in Simulink and then viewing the outputs on a separate scope.
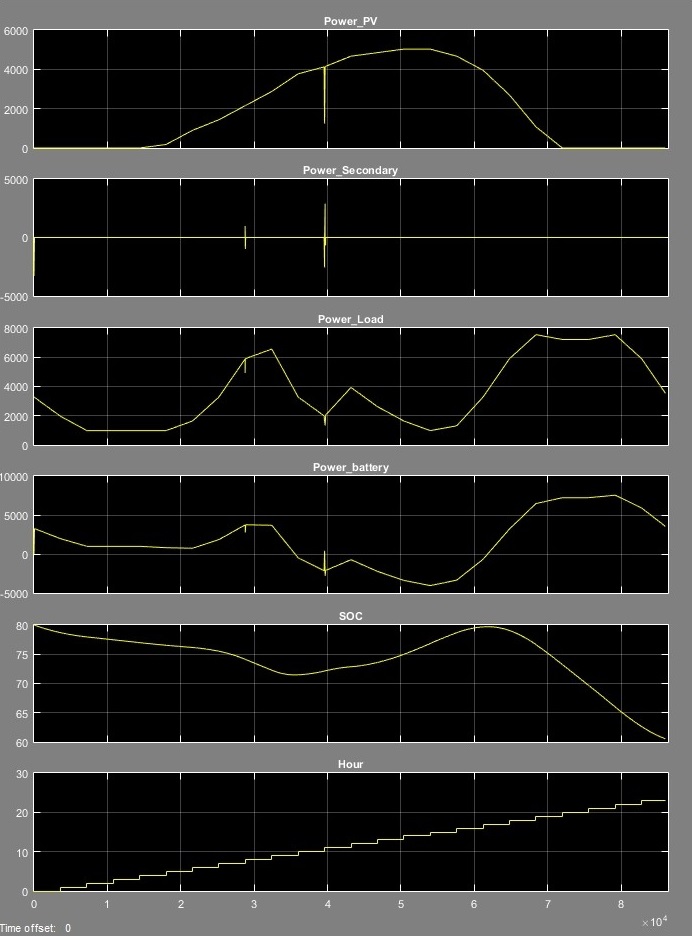
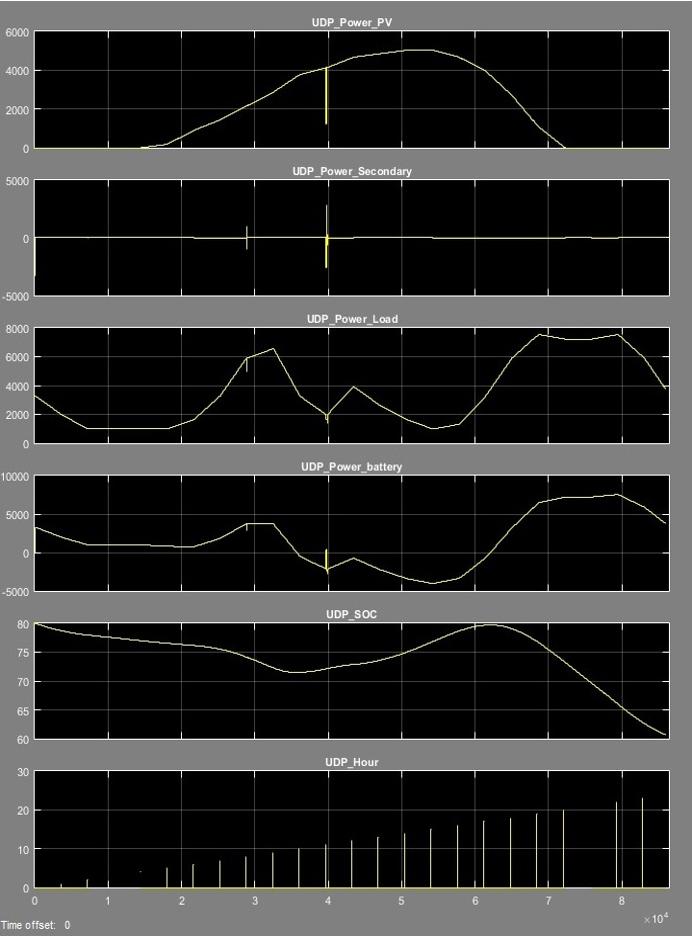
This yielded a relatively accurate wireless data transfer of the simulated information through the Raspberry Pi (see figure 7). As shown, even interruptions of as little as 10 seconds on the system were successfully transferred via UDP packets and translated to a separate interface via the Raspberry Pi. This was promising, in that we could assume that the loss was very miniscule in the grand scheme of this design, since most commercial monitoring systems do not get more granular than 1 to 5 minutes. Having such a fine resolution on our system would allow for increasingly accurate readings for the end user.
Thanks for reading! If you enjoyed that or are looking for more check out the full report and presentation by clicking on the red icon on the bottom left.